
Share this post
Why has the velocity of money been falling whilst QE is expanding?
December, 2021
The velocity of money measures how many times a pound or dollar is spent. It is a good indicator of whether firms and consumers are confident enough to go out and spend. It can therefore act as a barometer of economic growth. The more transactions in an economy, the healthier the economy.
Conventional economic theory explains that money velocity tends to fall in recessions as consumers and firms feel less confident, saving more than usual. As growth recovers, velocity increases as businesses and consumers spend more, often releasing the demand that has been pent-up during the recession.
As the chart below indicates the velocity of money has halved over the past 20 years, at odds with most conventional economic thinking. The last decade has seemed even more at odds to us with the perception of resurgent confidence and growth, emerging from the Great Financial Crisis which hit in 2008-09. The relationship between economic growth and recession exhibited previously in money supply (technically named M2) is no longer apparent. The deceleration in the money supply since the Covid Pandemic hit is even more marked.
Velocity of M2 Money Supply
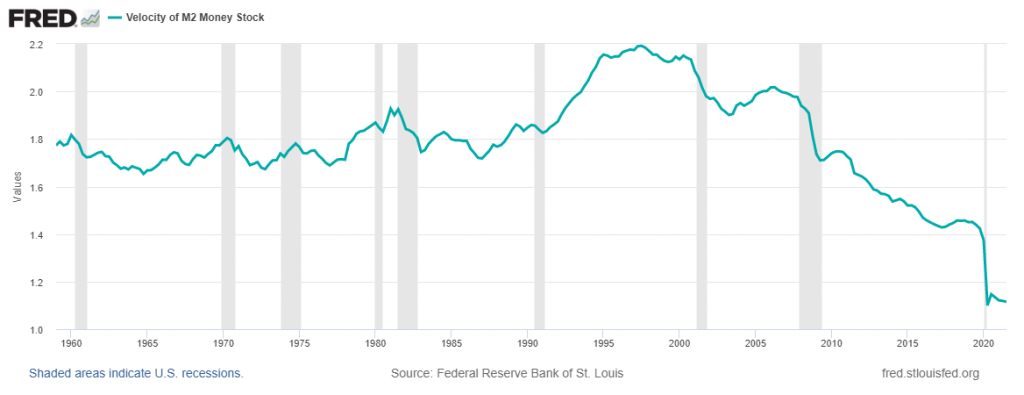
Source: Federal Reserve Bank of St. Louis, Velocity of M2 Money Stock [M2V], retrieved from FRED, Federal Reserve Bank of St. Louis; https://fred.stlouisfed.org/series/M2V, October 4, 2021., Seasonally Quarterly Adjusted. Data 1st January 1959 to 30th June 2021.
Many argue that the Covid pandemic has upended this relationship. Firstly, consumers have been unable to spend even if they wanted to because of lockdowns, and businesses have been desperate to conserve cash. Secondly, the unprecedented hit to confidence because of the shock of Covid has encouraged consumers to increase their savings because they are worried about the future. Thirdly, the memories of excess debt in the financial crisis are still present and many consumers (and businesses) are trying to pay down their debts.
The problem for the economy is that higher savings means lower spending and ultimately lower growth. Lower money circulation means fewer goods and services are being transacted. This is not a new phenomenon as the chart above shows. Paradoxically, many households are in better “balance sheet” shape today than they were before the crisis (illustrated by the latest figures for UK Household Wealth published yesterday).
The issue of low money velocity predates the Pandemic and if people, on average, are wealthier now than ever before, why does the velocity of money continue to fall?
We believe the answer probably lies in the side effects of Quantitative Easing: asset prices have risen but people are not selling these assets to supplement their spending. Those that have benefitted most from this rise already have enough income to meet their current needs. As more and more money has been printed, it has not actually entered the productive economy and has resulted in less economic benefit than conventional economic theory would suggest. This is one of the reasons we must be mindful of the ramifications on financial asset prices as central banks pull back from their emergency measures of the past decade: just as the introduction of QE gave rise to unintended and unexpected consequences, investors need to be equally careful to look out for the consequences of QE ending (when this finally happens at some point in the future). Investors should be prepared for general asset price volatility to rise as markets adjust, remembering that volatility can be both a foe and a friend.