As January draws to a close one point has confused many investors: why is my portfolio value down whilst the Footsie 100 has risen?
This observation is a valid one over this short period and we feel it needs explanation and putting into the context of history. Firstly, the geographic breakdown of our strategies is important to note as a backdrop to this note. The pie chart below illustrates this for our Steady Growth strategy and is very similar for all the portfolio strategies we manage.
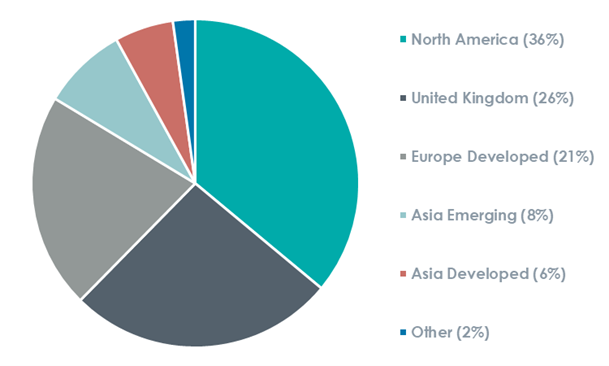
Source: Tacit Investment Management, Morningstar Direct, Geographic exposure of growth assets within the Steady Growth Portfolio as of 31st December 2021.
The investment rationale for our bias to international companies is a very straight forward one: the underlying cash flows and growth in these cash flows is higher and more broadly based outside of the United Kingdom than we can purchase by owning UK stocks. The UK equity market has many highly cyclical sectors which perform well in strong economic conditions but also underperformed during economic downturns. This is not bad but does increase the variability in cash flows of companies. These sectors have helped the UK equity market perform better than others this month.
The longer-term picture is very important to remember however, as one month does not necessarily repeat itself. The recent uptick in performance has been driven by the Oil and Banking sectors and excluding these the UK market would actually be flat to marginally down since the year end. It is therefore important to remember that market timing is very difficult, almost impossible to get right regularly, and therefore the underlying cash flows of the assets that you own are very important in an environment where inflation has risen. Companies that can grow their revenues ahead of inflation form year to year are extremely rare and valuable as these cashflows drive longer term investment returns.
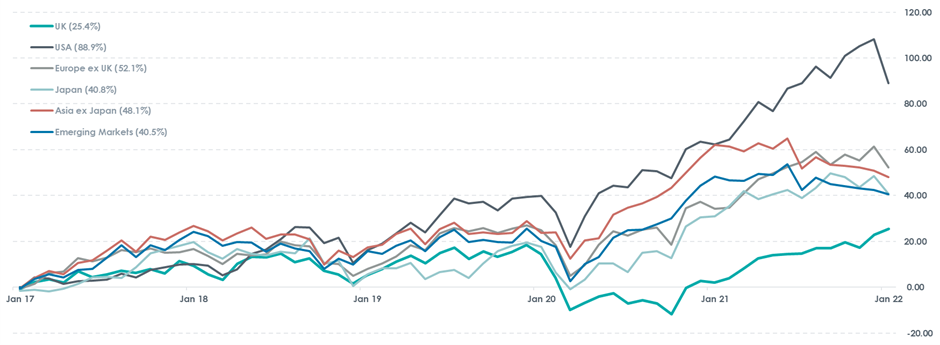
Source: Morningstar Direct, 5-year cumulative GBP Sterling total returns from 26th January 2017 to 26th January 2021. Underlying equity market performance is represented by the following index series: UK (MSCI United Kingdom GR USD), USA (MSCI USA All GR USD), Europe ex UK (MSCI Europe Ex UK GR EUR), Japan (MSCI Japan GR LCL), Asia ex Japan (MSCI AC Asia Ex Japan GR USD) & Emerging Markets (MSCI EM GR USD).
Very recently a rise in interest rate expectations has led to a fall in the values of more stable cashflow generating companies whilst Banks and Oil stocks have benefited from the better economic outlook. This occurred in early 2021 and has occurred in most years over the past decade. A reversal of this trend has been just as violent as investors realise that the global economy cannot sustain positive real interest rates (i.e. interest rates higher than inflation) as debt levels remain extremely high.
Our central thesis is that this will occur again, and that in such an environment a company that can grow its cashflows above the rate of inflation will become more valuable and its share price rise again.
The UK has very few of these companies and therefore remains a market we are underweight. Where we do have exposure, it is very carefully selected to manage the benefits of cyclical sectors against the drawbacks of our medium-term outlook on the economic growth picture. Valuation through the cycle is important to gauge rather than at peaks and troughs in the economic cycle.